Alex Quinn and Chris Ackermann
University of Maryland, Department of Computer Science
2/27/2007
Introduction
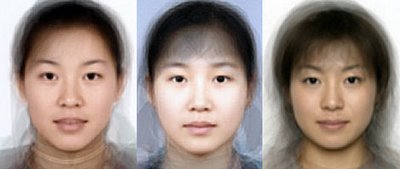
Researchers at the Harvard School of Dental Medicine have been studying differences in the way faces are perceived, relative to specific measures on the face. They are especially interested in how Caucasian standards for facial appearance have affected East Asian countries and how some people in those countries receive plastic surgery along with orthodontic treatment, in order to affect perceptions of similarity with other East Asian ethnicities, or in order to fit Caucasian norms. Orthodontists need to fully understand these implications in order to prescribe appropriate treatment and ensure satisfaction with the results.
As part of ongoing research, which included one PhD dissertation [1], the researchers asked 90 participants to each judge 120 female Asian faces. Subjects were were equally divided by ethnicity into Chinese, Japanese, Korean, and "other". Subjects were asked to guess the
- Ethnicity (Chinese, Japanese, or Korean)
- Age, height, and weight
- Attractiveness and expression (pleasant or unpleasant).
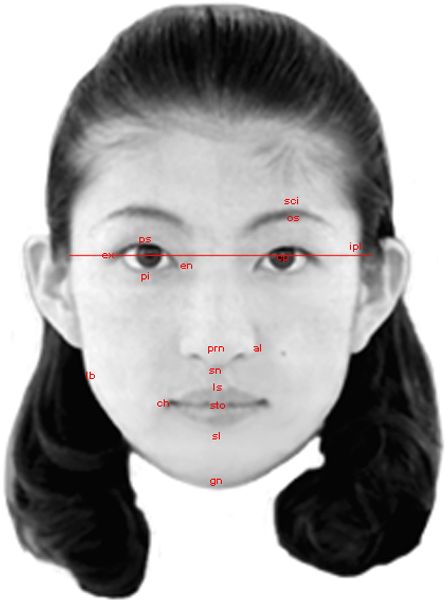
Landmarks of facial measures
What makes a pretty face? |
| Eye size, nose size, eyebrow thickness, and eye tiltiness indicate attractiveness. |
An analysis we conducted focused on the relationships between the facial metrics and their corresponding attractiveness. We will first define some measures that are computed from the metrics but represent facial features in more common terms:
- Eye size: This pertains to the height rather than the width, as the height what is considered to be related to attractiveness.
- Nose size: The nose size expresses the width and the height of the nose.
- Eyebrows: A measure for the height of the eyebrows.
In addition to the characteristics mentioned above, we also included the original measures in the analysis in order to allow for unexpected discoveries.
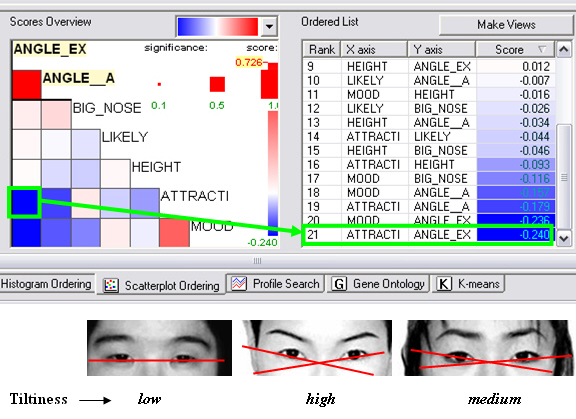 Discovery of the correlation between tiltiness and attractiveness.
Several correlation analyses were conducted with the measures mentioned above. Based on their correlation to attractiveness we can conclude that the respondents found faces with the following characteristics as more attractive:
- Big Eyes - CC = 0.33
- Small nose - CC = 0.26
- Thin eyebrows - CC = 0.24
- Tilted eyes - CC = 0.24: This unexpected discovery shows that tilted eyes (The degree to which the outer corner of the eye is higher than the right corner of the eye) are more attractive.
When two faces are almost the same... |
| Facial similarity can be determined using facial metrics. |
A main interest of the research group that conducted the study was to find out what faces are related based on the collected metrics (not the respondents judgment) and if these faces indeed look alike. To explore this, we looked at the data using the color mosaic in HCE and used the hierarchical clustering to find pairs of faces which are especially similar with respect to the facial measures. We found several pairs of similar faces.
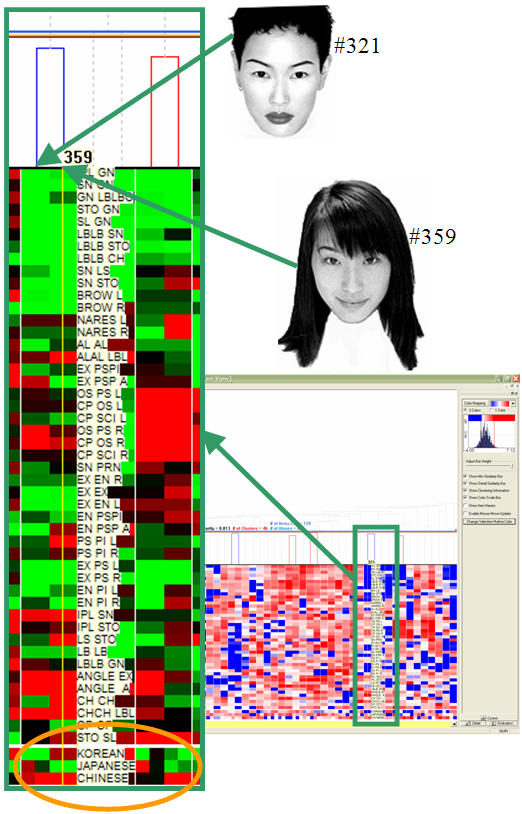
The diagram on the left is a magnified region of the dendogram behind it. The similar color scheme of the two far left columns highlighted by the arrows resembles the similarity of the two faces. The left column represents the characteristics of face #321 and the right column represents face #359.
Each of the vertical pairs of faces below was identified as similar by HCE's euclidean distance clustering. Looking at the lips, the space between the lips and chin, the shape of the face, and especially the eyes, it is intuitively clear why they were identified as similar.
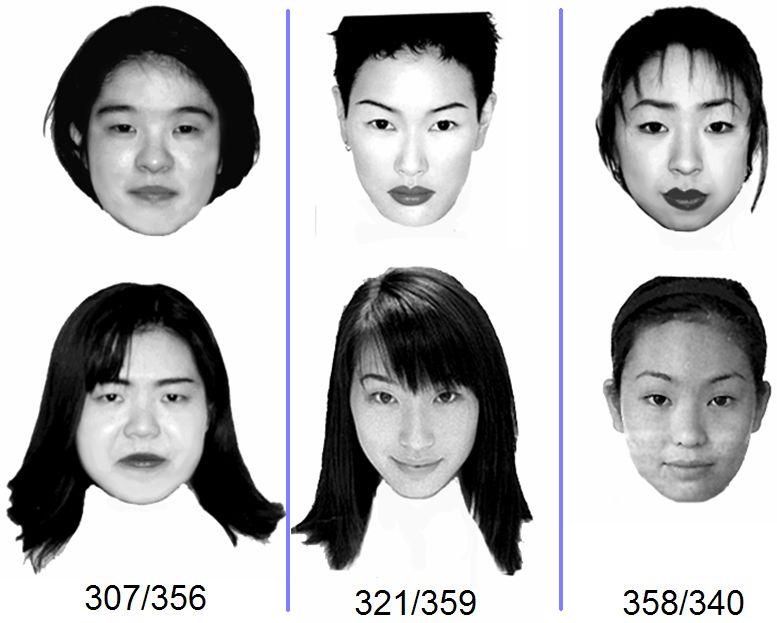
Sample faces from three of the clusters identified by HCE.
Chinese, Japanese, and Koreans: How people try to tell the difference... |
| Judgments of Chinese/Japanese/Korean are correlated with certain facial measures. |
A common perception is that Chinese, Japanese and Koreans have distinct facial features that make it possible to tell them apart. The following analysis shows if the respondents based their judgment as to what race the face is on certain facial measures.
We used HCE's scatter plot ordering feature to rank all pairs of facial metrics, along with the average confidence level that the face is of a given race. 1.0=most likely, 0.5=possibly, and 0.0=least likely. A surprising number of correlations were detected.
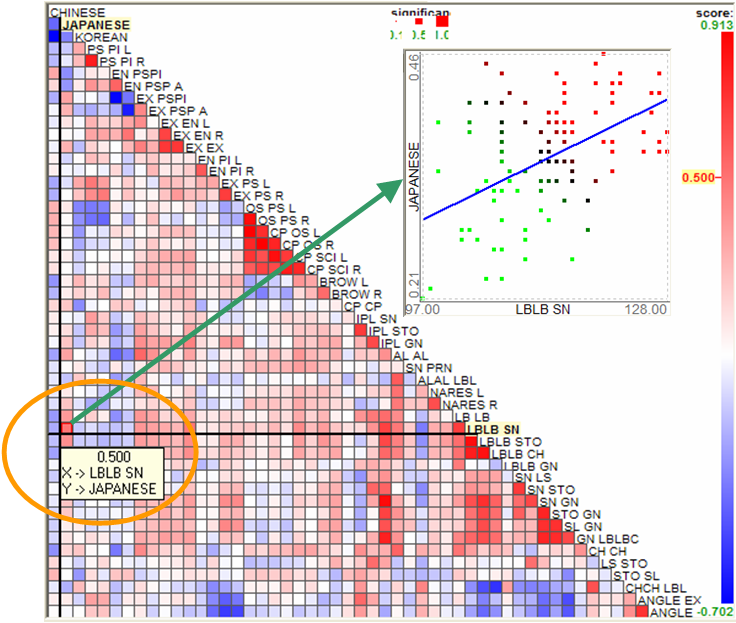 Results of correlation analysis in HCE.
The colored squares show the correlation coefficient for each pair of variables. Full red signals a high positive correlation and full blue signals a high negative correlation. Our focus was on the three far left columns as these represent the different races. All other columns represent facial metrics. According to the diagram, the different races can be identified by the following characteristics:
| Chinese | Japanese | Korean |
|
|
|
The features identified above have a correlation coefficient between 0.3 and 0.5 with the respective race. This shows that the respondents did indeed consistently judge the faces based on the characteristics captures by the metrics.
One of the biggest surprises we encountered during this project was when we learned that all of the faces were actually Japanese. We did not learn this from our collaborators until after all of our analysis was complete. This was in contrast with the subjects' judgments, which were, overall, 5167 (39.9%) Korean, 4528 (34.9%) Japanese, and 3269 (25.2%) Chinese.
A popular web site, www.alllooksame.com, has provided anecdotal evidence that people are unable to distinguish the ethnic identities of Chinese, Japanese, and Korean photographs. Visitors are shown photographs of East Asian people and try to classify them as Chinese, Japanese, or Korean. Web site statistics show an overall success rate of 7 correct out of 20 total photographs, roughly equivalent to random guessing.
Tool Critique
Strengths
- Medium sized datasets can be loaded and processes much more quickly than in other tools.
- A variety of analysis features are integrated into a single tool.
- Scatterplot ordering makes it possible to find correlations among columns with little effort.
- Options for hierarchical clustering allow the user to omit data fields or partition the fields in order to suit diverse analysis tasks.
- Statistical metrics and other analysis capabilities in the scatterplot ordering, histogram ordering, and preprocessing provide flexibility to support a variety of analysis tasks.
- Ability to adjust colors sometimes reveals features in the data that would otherwise not be apparent.
- The user manual is comprehensive, but also concise, so that users can understand the capabilities with a limited investment of time to learn the tool.
- Filtering options are less flexible than other tools, such as Spotfire.
- A great deal of preprocessing is required in order to aggregate and prepare the columns.
- Crashes or behaves erratically when there are null or string values in numeric data columns.
- Although the tool is very usable, it suffers from a lack of software maturity, as evidenced by occasional crashes and awkwardness in resizing or manipulating interface controls.
- Data field labels only show on the color mosaic when it is sufficiently large, but it is often difficult to adjust the screen to make the mosaic big enough. There is no way to let the mosaic take up the entire application area.
- The dendrogram tree cannot be resized, so it is often difficult to move the minimum similarity bar to the desired level.